この記事はAndroidスマホ用のアプリ開発の中で、
今後の開発で再使用性が高いと思われるコーディングをまとめたものです。
Javaでの開発経験、XML構文規則、Androidのアプリ開発経験がある方を対象としています。
Androidのアプリ開発でお役にたててれば、嬉しいです。
(これからAndroidのアプリ開発やJavaでの開発を始めたい方への案内は、記事の最後で紹介します)
MPAndroidChartを使用して、折れ線グラフを実装をする
MPAndroidChartは、Androidアプリでグラフを作るためのオープンソースライブラリです。
Andoridアプリでグラフを描画する場合のベストプラクティスといっても過言ではありません。
非常に多機能で細かい部分まで制御できる素晴らしいライブラリですが、使用方法について、詳しい日本語ドキュメントがなく、機能の一部しか利用されていない、残念な状況です。
MPAndroidChartは、さまざまなグラフを扱うことが可能です。
開発したアプリのソースを参考に折れ線グラフ(LineChart)の使用方法について説明します。
棒グラフ(BarChart)については、こちらです↓↓↓
円グラフ(PieChart)については、こちらです↓↓↓
散布図(ScatterChart)については、こちらです↓↓↓
MPAndroidChart を使用するための準備
MPAndroidChart を使用するには、プロジェクトおよび、モジュールのbuild.gradleファイルに定義の追加が必要です。
◎build.gradle(プロジェクト)
:
allprojects {
    repositories {
    :
        maven { url "https://jitpack.io" }
    }
}
:
◎build.gradle(モジュール)
2022年11月現在の最新バージョンは 3.1.0 です。
dependencies {
    :
    implementation 'com.github.PhilJay:MPAndroidChart:v3.1.0'
}
◎ライセンス表記
MPAndroidChartはApache License, Version 2.0です。
アプリで使用する場合、ライセンス表記が必要です。
折れ線グラフ( LineChart )
折れ線グラフは、時系列など連続的な変化を捉えるときに使用するグラフです。
データをX軸に時間、Y軸に測定値を配置して、それぞれのデータを線で結んだグラフです。
MPAndroidChart には、直線で結ぶ方法以外に滑らかな曲線(ベジェ曲線)で結ぶことが可能です。
グラフ表示
MPAndroidChartのグラフ表示は、グラフに表示する折れ線をLineDataSetとして作成、LineChartにLineDataを介して、セットします。
グラフの背景、表示範囲、振る舞いなどの属性は、グラフに定義します。
凡例、軸ラベル、線の太さや色などの属性は、データセットに定義します。
複数のデータセットをラインデータにセットすることで、1つのグラフに複数の線グラフを重ねて表示できます。
    private LineChart               acceleration;
    private String[]                labels = new String[]{
            "Speed(GPS)",
            "Longitudinal",
            "Lateral",
            "Pitch",
            "Roll",
            "Locus",
            "Position"};
    private LineDataSet             lineDataSet2X;
    private LineDataSet             lineDataSet2Y;

    :
  // 凡例(ラベル)を設定
    lineDataSet2X = new LineDataSet(null,labels[2]);
    lineDataSet2Y = new LineDataSet(null,labels[1]);
    :
    // 加速度グラフ
    acceleration = findViewById(R.id.acceleration);
    acceleration.setOnChartGestureListener(new OnChartGestureListener() {
            @Override
            public void onChartGestureStart(MotionEvent me, ChartTouchListener.ChartGesture lastPerformedGesture) {
                 // グラフに触れた時の処理
            }
            @Override
            public void onChartGestureEnd(MotionEvent me, ChartTouchListener.ChartGesture lastPerformedGesture) {}
            @Override
            public void onChartLongPressed(MotionEvent me) {}
            @Override
            public void onChartDoubleTapped(MotionEvent me) {}
            @Override
            public void onChartSingleTapped(MotionEvent me) {
                // グラフをタップした時の処理
            }
            @Override
            public void onChartFling(MotionEvent me1, MotionEvent me2, float velocityX, float velocityY) {}
            @Override
            public void onChartScale(MotionEvent me, float scaleX, float scaleY) {}
            @Override
            public void onChartTranslate(MotionEvent me, float dX, float dY) {
                // グラフを左右に動かした時の処理
            }
        });
        :
   }
    :
    // データセットの属性セット
    lineDataSet2X.clear();
    lineDataSet2X.setColor(getColor(R.color.red));              // 線の色指定
    lineDataSet2X.setDrawCircles(false);                        // 点を描画しない
    lineDataSet2X.setDrawValues(false);                         // 点の値を表示しない
    lineDataSet2X.setDrawHorizontalHighlightIndicator(false);   // X軸ハイライト線非表示
    lineDataSet2X.setDrawVerticalHighlightIndicator(false);     // Y軸ハイライト線非表示
    lineDataSet2X.setMode(LineDataSet.Mode.CUBIC_BEZIER);       // ベジェ曲線
    lineDataSet2Y.clear();
    lineDataSet2Y.setColor(getColor(R.color.blue600));
    lineDataSet2Y.setDrawCircles(false);
    lineDataSet2Y.setDrawValues(false);
    lineDataSet2Y.setDrawHorizontalHighlightIndicator(false);
    lineDataSet2Y.setDrawVerticalHighlightIndicator(false);
    lineDataSet2Y.setMode(LineDataSet.Mode.CUBIC_BEZIER);
    :
    // データセットをラインデータに追加
    LineData lineData2 = new LineData(lineDataSet2Y);
    lineData2.addDataSet(lineDataSet2X);
    :
    acceleration.getDescription().setEnabled(false);            // 説明表示なし
    acceleration.setDrawGridBackground(true);                   // 罫線の表示
    acceleration.setGridBackgroundColor(Color.TRANSPARENT);     // グラフの背景
    acceleration.setData(lineData2);                            // ラインデータをセット
  :
    // データをデータセットに追加
  {
        lineData2.addEntry(new Entry((float) nowTime / 1000, (float) bg[1]), 0);
        lineData2.addEntry(new Entry((float) nowTime / 1000, (float) bg[2]), 1);
  }
    :
    acceleration.setVisibleXRangeMaximum(12);                    // グラフのX軸の表示範囲
    acceleration.notifyDataSetChanged();
    acceleration.invalidate();                   // グラフの再描画
    acceleration.setDoubleTapToZoomEnabled(false);         // ダブルタップのズーム無効
  :
}X値、Y値、データセットに追加順を設定したEntryをデータセットにaddERntryします。
◎Layoutリソース
            <ScrollView
                android:layout_width="match_parent"
                android:layout_height="match_parent"
                android:fadeScrollbars="false">
                <LinearLayout
                    android:layout_width="match_parent"
                    android:layout_height="wrap_content"
                    android:orientation="vertical">
           :
                    <LinearLayout
                        android:layout_width="match_parent"
                        android:layout_height="wrap_content"
                        android:orientation="horizontal">
                        <com.github.mikephil.charting.charts.LineChart
                            android:id="@+id/acceleration"
                            android:layout_width="0dp"
                            android:layout_height="264dp"
                            android:layout_weight="1"
                            android:background="@android:color/transparent" />
                        <TextView
                            android:layout_width="16dp"
                            android:layout_height="264dp"
                            android:background="@android:color/transparent" />
                    </LinearLayout>
           :
                </LinearLayout>
</ScrollView>グラフ全体をスクロールさせる場合、LinearLayoutでグラフを囲み、さらにスクロール領域をScrollViewで囲みます。
スクロールがしやすいようにグラフの右側にTextViewを配置します。
スクロールバーを常に表示にする場合は、fadeScrollbarsをfalseに設定します。
MPAndroidChart の折れ線グラフの背景を透過させる方法はこちらです↓↓↓
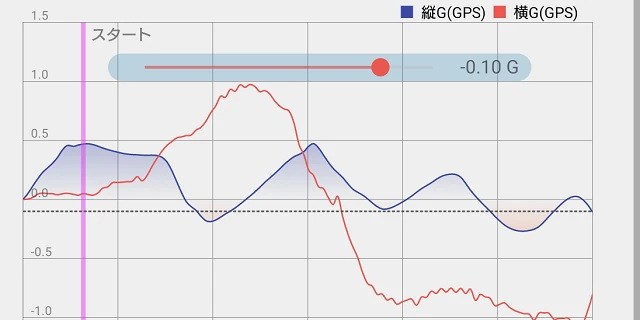
グラデーション表示
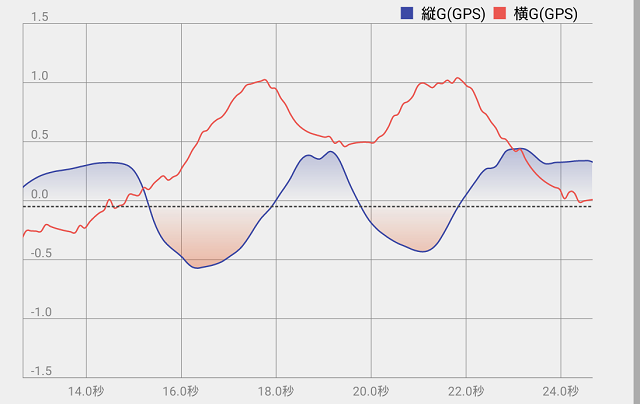
グラフ表示で折れ線の内側を塗りつぶすことが可能です。
塗りつぶす色にDrawableリソースを指定することで、グラデーション表示が可能になります。
    :
    lineDataSet2Y.setDrawFilled(true);
    lineDataSet2Y.setFillDrawable(getDrawable(R.drawable.mp_grad422));
    :
    acceleration.getAxisLeft().setAxisMinimum(-1.5f);
    acceleration.getAxisLeft().setAxisMaximum(1.5f);
    :
プラス値は青、マイナス値は赤で分離するには、グラフのY軸下限とグラフのY軸上限の絶対値を同じにします。
◎Drawableリソース(mp_grad422)
<shape xmlns:android="http://schemas.android.com/apk/res/android" >
    <gradient
        android:angle="270"
        android:startColor="#FF3232B0"
        android:centerColor="#00000000"
        android:endColor="#FFFF5722" />
</shape>
リミット線の表示
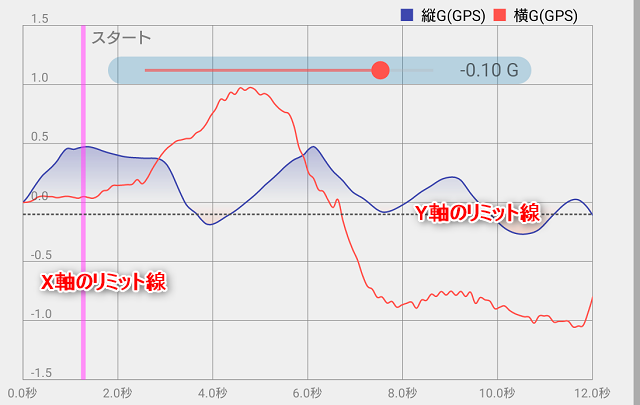
グラフの罫線以外に目安となるLimitLineを設定することができます。
各軸で線を引く値を設定したLimitLineを作成し、LineChartにaddLimitLineします。
enableDashedLineを使用することで、破線が使用できます。
        :
        // Y軸のリミット線
        LimitLine y= new LimitLine(deceleration ,null);
        y.enableDashedLine(5,3,0);                      // 破線(5:3:0)
        y.setLineColor(getColor(R.color.grey));         // Limit Lineの色
        y.setLineWidth(1);                              // Limit Lineの太さ
        acceleration.getAxisLeft().addLimitLine(y);     // Y軸に追加
        :
        // X軸のリミット線
        LimitLine x = new LimitLine(start, getString(R.string.start));
        x.setLineColor(getColor(R.color.purple));       // Limit Lineの色
        x.setLineWidth(3);                              // Limit Lineの太さ
        x.setTextSize(10);                              // テキストサイズ
        x.setTextColor(getColor(R.color.grey));         // テキスト色
        acceleration.getXAxis().addLimitLine(x);        // X軸に追加
        acceleration.moveViewToX(startPos);             // X軸の初期値を設定
:リミット線の作成時、decelerationとstartは線を引く値、第2引数にテキスト表示する文字列を指定します。
moveViewToXを使用することでグラフ表示の開始位置を指定できます。
軸ラベルの表示位置と書式
LineChartのAxisを操作することで、軸ラベルの表示・非表示、位置、書式を設定できます。

        :
        // X軸ラベル
        lineChart.getAxisRight().setEnabled(false);                   // 右側は非表示
        lineChart.getXAxis().setTextSize(8);                          // テキストサイズ
        lineChart.getXAxis().setTextColor(getColor(R.color.grey));    // テキスト色
        lineChart.getXAxis().setPosition(XAxis.XAxisPosition.BOTTOM); // 下側に表示
        lineChart.getXAxis().setValueFormatter(new ValueFormatter() {
            @Override
            public String getFormattedValue(float value) {
                return String.format(formatX, value);                 // %.1f秒
            }
        });
        :
        // Y軸ラベル
        YAxis yAxis = lineChart.getAxisLeft();
        yAxis.setPosition(YAxis.YAxisLabelPosition.INSIDE_CHART);     // グラフ内側に表示
        yAxis.setYOffset(-4);                                         // Y軸方向に-4オフセット
        yAxis.setTextSize(8);                       // テキストサイズ
        yAxis.setTextColor(getColor(R.color.grey));                   // テキスト色
        yAxis.setValueFormatter(new ValueFormatter() {
            @Override
            public String getFormattedValue(float value) {
                return String.format(formatY,value);                  // %.1f
            }
        });
        :
凡例の表示位置
LineChartのLegendを操作することで、凡例の表示位置を設定できます。
  :
    lineChart.getLegend().setVerticalAlignment(Legend.LegendVerticalAlignment.TOP);
    lineChart.getLegend().setHorizontalAlignment(Legend.LegendHorizontalAlignment.RIGHT);
    :
凡例をグラフの右上に表示します。
マーカーの表示
グラフをタッチした位置のデータ値を、マーカーを使用して表示できます。
表示する内容を加工したい場合は、カスタムマーカーを作成します。
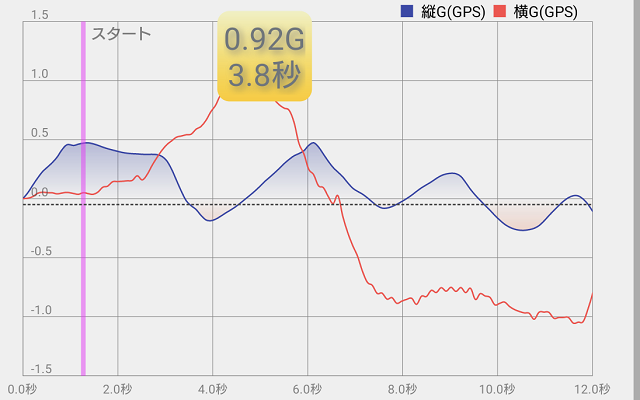
LineChartのMarkerViewをsetMarkeすることで、タップした位置にマーカーを表示できるようにします。
表示する内容を変更する必要があるため、マーカーの代わりにカスタムマーカーを生成して、グラフに設定します。
    :
    // マーカー設定
    CustomMarkerView customMarkerView = new CustomMarkerView(context, R.layout.marker_view, arrayList);
    customMarkerView.setFormat(formatMarker);
    customMarkerView.setChartView(lineChart);
    lineChart.setMarker(customMarkerView);
:◎CustomMarkerView クラス
軸(時間)とY軸(データ値)を 2段で表示するマーカーです。
時間については、リミット線の時間配列からの経過時間を計算して表示します。
マーカーの表示位置は、タップ位置を中心に Y軸方向を-20オフセットします。
public class CustomMarkerView extends MarkerView {
    private String                  format = "%.0f\n%.0f";
    private final ArrayList<Float>  arrayTime = new ArrayList<>()    ;
    //コンストラクタ
    public CustomMarkerView(Context context) {
        super(context, 0);
    }
    public CustomMarkerView(Context context, int layoutResource, ArrayList<Float> arrayList) {
        super(context, layoutResource);
        arrayTime.addAll(arrayList);
    }

    @Override
    public void refreshContent(Entry e, Highlight highlight) {
        super.refreshContent(e, highlight);
        TextView textView = findViewById(R.id.marker);
        float time = 0;
        for (Float split : arrayTime) {
            if (e.getX() > split)
                time = split;
            else
                break;
        }
        textView.setText(String.format(format, e.getY(), time > 0 ? e.getX() - time : arrayTime.size() > 0 ? 0 : e.getX()));
        super.refreshContent(e, highlight);
    }

    @Override
    public MPPointF getOffset() {
        return new MPPointF(-(getWidth() / 2f), -(float)(getHeight() - 20f));
    }

    public void setFormat(String format) {
        this.format = format;
    }
}◎Layoutリソース(marker_view)
<?xml version="1.0" encoding="utf-8"?>
<RelativeLayout
    xmlns:android="http://schemas.android.com/apk/res/android"
    xmlns:tools="http://schemas.android.com/tools"
    android:layout_width="wrap_content"
    android:layout_height="wrap_content"
    android:background="@drawable/bt_grad_yellow"
    tools:ignore="Overdraw">
    <TextView
        android:id="@+id/marker"
        android:layout_width="wrap_content"
        android:layout_height="wrap_content"
        android:layout_centerHorizontal="true"
        android:layout_marginStart="4dp"
        android:layout_marginTop="4dp"
        android:layout_marginEnd="4dp"
        android:layout_marginBottom="4dp"
        android:shadowColor="@color/grey"
        android:shadowDx="5.0"
        android:shadowDy="5.0"
        android:shadowRadius="10.0"
        android:ellipsize="end"
        android:gravity="center_vertical|center_horizontal"
        android:textAppearance="?android:attr/textAppearanceSmall"
        android:textSize="20sp" />
</RelativeLayout>◎Drawableリソース(bt_grad_yellow)
<shape xmlns:android="http://schemas.android.com/apk/res/android" >
    <corners android:radius="8dp" />
    <gradient android:startColor="@color/yellow" android:endColor="@color/white" android:angle="90" />
</shape>
マーカー表示をコードで書く方法、複数のマーカーを表示する方法はこちら↓↓↓
MPAndroidChart を使用して折れ線グラフを実装しているAndroidアプリです。
今回は、ここまでです。
誤字脱字、意味不明でわかりづらい、
もっと詳しく知りたいなどのご意見は、
このページの最後にあるコメントか、
こちらから、お願いいたします♪
ポチッとして頂けると、
次のコンテンツを作成する励みになります♪
これからAndroidのアプリ開発やJavaでの開発を始めたい方へ
アプリケーション開発経験がない方や、アプリケーション開発経験がある方でも、JavaやC#などのオブジェクト指向言語が初めての方は、Androidのアプリ開発ができるようになるには、かなりの時間がかかります。
オンラインスクールでの習得を、強くおススメします。
未経験者からプログラマーを目指すのに最適です。まずは無料カウンセリングから♪

ゲーム系に強いスクール、UnityやUnrealEngineを習得するのに最適です。まずは無料オンライン相談から♪

参考になったら、💛をポッチとしてね♪



コメント欄